Solution Database / Operations
Shelf Photo Stock Counter
Stock counts rely on clipboards and guesswork, causing waste and stockouts. A single photo becomes an order and a waste log with photo evidence, cutting count time and guesswork in one pass.
01The offer
For operations managers at multi-site cafe groups and small supermarket chains, turn shelf photos, POS sales data and supplier catalogues into a draft supplier order with a waste flag list for approval. Address the recurring problem: stock counts rely on clipboards and guesswork, causing waste and stockouts. The value hypothesis is fewer missed deliveries and less waste; the pilot must establish whether that benefit is real.
- For
- Operations managers at multi-site cafe groups and small supermarket chains
- Takes in
- Shelf photos, POS sales data, supplier catalogue, weekday pars
- Delivers
- Approved supplier order and waste log with photo evidence
- Message
- Turn a shelf photo into next week's order and waste log before your coffee cools.
- Lead magnet
- A free shelf photo analysis for one zone, showing the draft order and waste flags for a single day.
02How it works
- Recognise SKUs from label text, barcode, can shape or shelf position
- Count visible units per SKU from a single photo
- Compare counts against weekday pars and POS depletion rates
- Generate a draft supplier order with quantities and suggested lines
- Flag discrepancies where stock fell faster than sales explain
- Attach the source photo to every flagged line for review
Workflow
Photograph shelves, confirm zone coverage, review recognition confidence, adjust counts where needed, review draft order, approve flagged waste lines, and send the order to the supplier. Start with shelf photos, POS sales data and supplier catalogue and finish with approved supplier order and waste log.
AI and people
Use vision models to detect and count products, and language models to match recognised items to catalogue entries. Keep counts and par values in structured fields. Validate totals and order quantities through deterministic checks. A manager reviews flagged discrepancies and the final order before it sends.
Screens
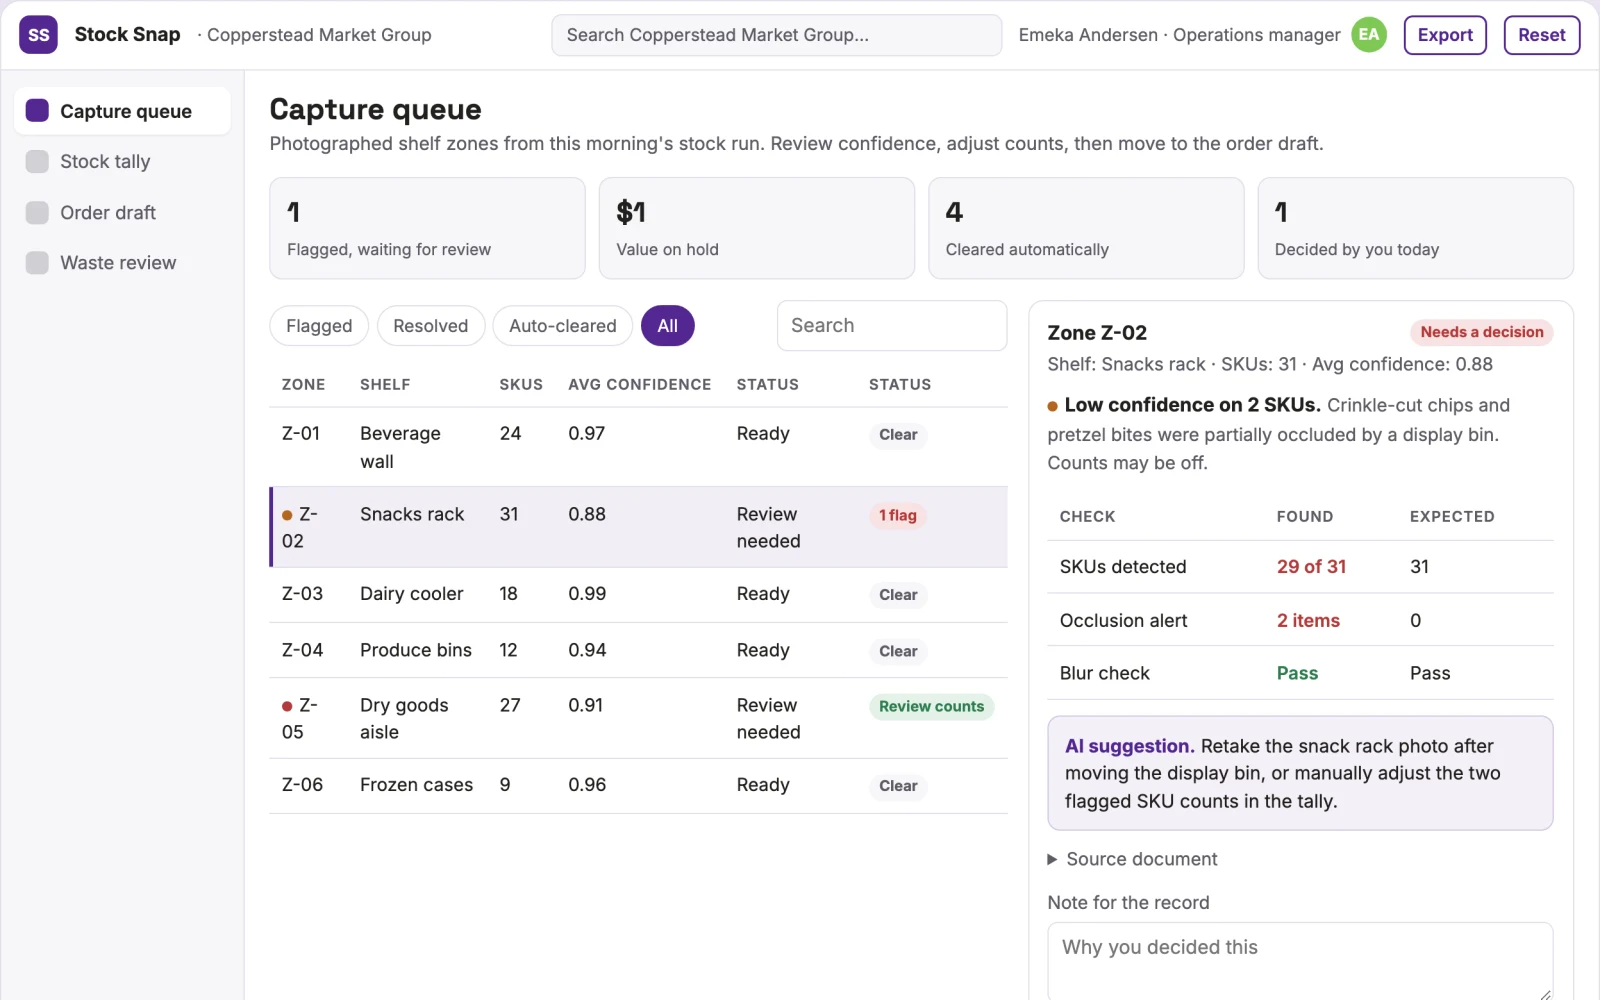
Key screens: Capture queue, stock tally, order draft, waste review. Use a photo grid for capture status, a SKU-level count table with confidence indicators, a draft order with line-by-line adjustments, and a waste review panel showing flagged lines with the original photo. Let users approve or edit each line. Display par, usage and discrepancy for every SKU. In this product, the first view is capture queue, followed by stock tally, order draft and waste review.
Admin
Site ownership, photo timestamps, user roles, order versions, approval states, audit trail of count adjustments, and a record of which manager approved each order.
03Market gap
Alternatives buyers use today
Clipboards, spreadsheets and manual reordering. This differs by turning an existing photo habit into a structured count and order draft with waste flags, rather than adding another data entry step.
Where this wins
The system learns each site's shelf layout, par behaviour and packaging quirks, so switching costs rise as the recognition model is tuned to the client's catalogue and daily rhythms.
04Why now
Operations teams are adopting AI for exactly this kind of repeatable work, and the cost of language and vision models has dropped far enough that a narrow, reviewed workflow pays back quickly. Rising compliance and audit expectations make a documented, reviewable process worth more than an ad hoc one. The buyer already feels the problem: stock counts rely on clipboards and guesswork, causing waste and stockouts.
05Proof & signals
Channels where buyers gather: Industry trade shows, food service distributor partnerships, and targeted LinkedIn outreach to district managers in cafe and supermarket groups.. Metrics that prove it works: Two measurable outcomes: count time reduced by 50% per site per week, and waste value reduced by 15% within the first quarter..
Paid pilot
Run a four-week paid pilot at one site. Baseline: manual count time and weekly waste value. Decision: continue if the draft order is accepted without edits for 80% of lines and waste flags catch at least one real issue per week.
06Execution plan
MVP
One buyer: operations manager at a three-site cafe group. One use case: dry store counts. First two modules: photo capture and SKU recognition, plus draft order generation. Manual review of all flagged lines and order totals.
First 30 days
Week 1: Build photo capture and upload flow. Week 2: Train recognition on the top forty SKUs from the pilot site. Week 3: Connect par and POS CSV import, generate draft orders. Week 4: Run a live trial with two sites and collect accuracy feedback.
After the pilot
After the paid pilot, automate POS integration for depletion rates, add cold room and prep bench zones, and introduce automatic retraining when packaging changes are detected.
Retention
The system learns each site's pars and packaging quirks, so it becomes more accurate over time. Monthly retraining and new SKU onboarding keep it sticky, and the waste log builds a trend report that managers rely on.
Integrations
POS systems for sales data, supplier catalogue feeds, and email or API for order submission. Start with a CSV export from the POS and a manual supplier order upload.
07Investment and running costs
| Phase | Scope | Time | Budget |
|---|---|---|---|
| MVP | One buyer segment, one recurring use case; first modules: photo capture and SKU recognition, plus draft order generation. Manual review in the loop. | 2 days | $5,500 |
| Paid pilot | Accounts, roles, review states, audit trail and the first integration, hardened for two to three paying pilot customers. | 3 days | $5,000 |
| Full product | Self-serve onboarding, billing, monitoring and the wider integration set. | 6 days | $6,500 |
| Total | $17,000 | ||
| Running | Hosting | AI usage | Total a month |
|---|---|---|---|
| MVP and paid pilot (about 3 customers) | $30–$60 | $80–$160 | $110–$220 |
| Full product (about 50 customers) | $110–$210 | $880–$1,750 | $990–$1,960 |
Revenue model to test
Test pricing at USD 300 per site per month, with a setup fee of USD 1,500 for catalogue mapping and recognition training.
Cost drivers
Cloud vision API usage, model retraining compute, integration engineering for POS and supplier feeds, and support time for packaging changes.
Safeguards
Limit photo capture to authorised staff with timestamps and geotags. Require manager approval before any order sends. Do not auto-order without human sign-off. Keep a full audit trail of count adjustments and approvals. The system must not delete or override par values without an explicit manager action.
Take it further
Solution blueprint, rewritten from an earlier Nexibeo concept. Demand, pricing, build scope and integrations are working assumptions, not verified market findings. The MVP and the paid pilot exist to confirm them for your business before the larger build.